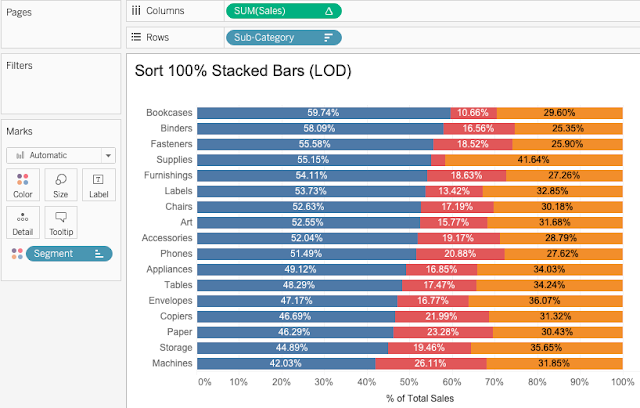
The 100% Stacked Bar Chart is the one where each segment is a percentage, which adds up to 100%.
Someone asked me recently how to sort the bars according to a segment's percentage. I thought it must be easy: Just google it. Then I tried myself and didn't find a satisfactory reference. So I decided to write one. In the process I did get inspirations from these two sources: Sorting a stacked bar chart using a parameter and a solution by Zhouyi Zhang in the Tableau's community site. Here I am going to present two solutions: using LOD (Level of Details) and Table Calculations.LOD vs Table Calculations
Both are good for implementing most of Tableau designs. One or the other, depends on our choice. The main difference is:
- LOD: It's context sensitive. We need to use context filters in the chart if necessary.
- Table Calculations: Regular filters work well. We have to set computing directions correctly.
LOD solution
The key is to create a parameter [Para Segment] based on Segment and a parameterized segment percentage [Para Sales %] using LOD. With LOD, we ensure that this value can be used in Sort function. Note that we use ZN() to get 0% when the segment in question doesn't exist.Then sort [Sub Category] vertically and Segment horizontally by the same field of [Para Sales %]:
Note that one sort is ascending and the other is descending. Here is the result:Table Calculations Solution
Tableau often allows more than one solutions to one problem. Here I am going to show another solution based on table calculations.
First let's create a calculated field for the selected segment's percentage. Make sure to set the computation along Segment! Use ZN() to get 0%.
With a negative sign as a discrete value, this can be used as an ordering item by being placed at the leftmost position on Rows. Hide the header afterwards. BTW this is a sorting technique when the value is derived from table calculations. We can't use it in Sort function because of table calculations.
Last but not the least, sort Segment by Selected Sales ascendingly. Horizontally, this will keep the selected segment always on the left.
Voila, both LOD and table calculations methods will give us the same result. We can sort the 100% stacked bar chart by a segment's percentage.


No comments:
Post a Comment