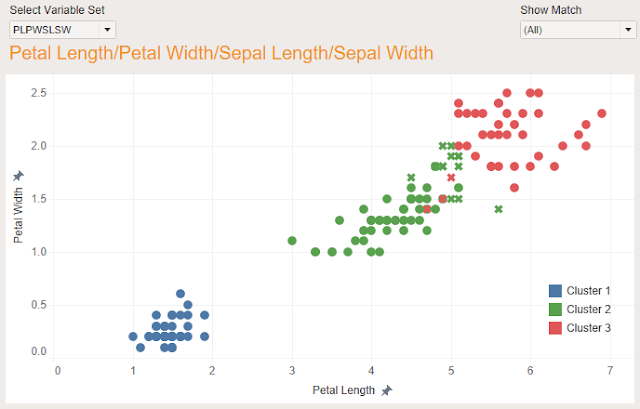
Following previous post on Iris Classification via Clustering in Tableau, we are going to analyse and compare the quality of clustering in Tableau by using 1,2,3 and 4 variables based on the Iris data set. We will use both automatic clustering and pre-specified number of clusters.
In the Iris data set, we know there are 3 clusters or classes of flowers. In some of the cases with a combination of measures/variables, Tableau can figure out automatically there are 3 clusters. We don't need to tell it a priori. In other cases, Tableau will find more or less than 3 by automatic clustering. Then in order to compare with all others, we will pre-specify the number of clusters to be 3.
Variable and Clustering Settings
- Create a scatter plot using Petal Length, Petal Width and ID (See previou post)
- Go the Analytics tab and drag Cluster to the canvas to create clusters
- In the Variable setting, we can add/remove variables. The default variables are the ones in view, like Petal Length and Petal Width. But they don't have to be the ones used for clustering. We can add 1 to 4 variables as there are in total 4 measures in the data set.
- In the Cluster setting, we can either leave it to be automatic or specify the number of clusters.
Clustering
There are two options for clustering: automatic or pre-specify. The produced cluster can be moved to the dimension pane as groups.
The symbol before the cluster name means geographic dimension. In reality, each cluster is like a group.
Automatic Clustering
We found that there are 9 combinations of variables where the automatic clustering produces the expected number of clusters: 3
Pre-Specify the Number of Clusters
In other cases than the above, the automatic option does not produce the expected number of clusters. Since we know there are 3 clusters and for the purpose of comparison, we can set the number of clusters to be 3. The cases include all the possible combinations of measures from 1 variable to 4 variables.
Variable Sets
Given 4 possible measures, we have 15 possible sets of variables as follows.
We have a shortened notion for the above sets, for example, PLSW = Petal Length / Sepal WidthParameterized Scatter Plot
Quality of the Clustering
The fewer the mismatches the better the variable set under the algorithm. Using Petal Length and Petal Width (PLPW) we got the best match for automatic clustering: 6 mismatches out of 150 records. Using Petal Width (PW) alone, we got the best match with pre-specified number of clusters: 6 mismatches out of 150 records. Petal Length (PL) got 7 mismatches. More variables/measures don't mean better results. A single variable can produce pretty good result.


No comments:
Post a Comment