I almost named the post as Charting "Top N and Others" via Post-filtering. Read on to understand why.
Visualizing "Top N and Others" is an often required business use case. A popular solution is by creating a top N set. That's the one I have been using through the years.
I wrote a post in the context of a pie chart back in 2014 on grouping those smaller slices into 'Others'.
Recently, I encountered an issue at work. The dashboard won't let me using set. The problem with this set-based solution is that "set" is a filter operating before the regular dimension filters. We may want the dimension filters to execute before the set. This can be done by adding the dimension filters to context. In a multi-sheet dashboard, this may impact calculations on other sheets when a cross-sheet filter is applied, where the dimension filters may not be allowed to be in context.
There are almost always two ways to skin a cat in Tableau: Pre-filtering and post-filtering.
Post-filtering: Filter the calculation results and keep the results we need. This works with table calculation filters.
Here we are going to show a table calculations approach to solve the problem. Table calculations filtering takes place in the last stage in Tableau's order of operations. So it works after the regular dimension filters. This is a post-filtering approach.
We are going to show our approach using the superstore data set and chart sales in top N states plus all others in one bar.
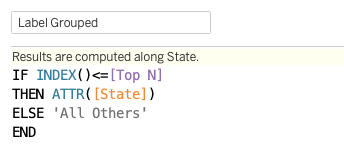
Then create a formula for Label Grouped which includes the top N states plus "All Others".

Third, create a formula for Sales Grouped where all sales beyond top N states are grouped in a single quantity.

Last, create a top N+1 index filter for keeping the top N+1 bars.

The resulting chart looks like this:
.png)

No comments:
Post a Comment