Dynamic Date Granularity for Analysis
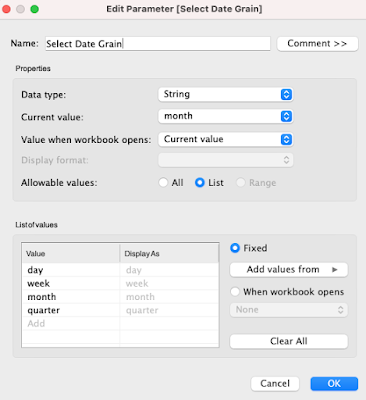
We may need to create a trend chart according to variable date granularities, such as day/week/month/quarter etc via a parameter. This can be done fairly easily through 2 steps:
- Create a parameter Select Date Grain that has options as day/week/month/quarter
- Create Date Grain as a new date dimension
- DATETRUNC(Select Date Grain, Order Date)
That's it! We can use the above to create bar or line chart. Via the parameter, we will be able to analyze time series data at different granularity.
Show Missing Date Grains Dynamically
Here is a solution we found. The key is using date differences vs the max date as a dimension.
- Create a granular DateDiff field versus the Max Date Grain in the data set
- Max Date Grain={MAX([Date Grain])}
- DateDiff = DATEDIFF([Select Date Grain],[Date Grain],[Max Date Grain])
- Create bins based on DateDiff with step = 1. Place this bins field DateDiff (bin) on the Rows first. Right click on it and select "Show missing values". Then drag it to the Details card.
- Create a densified date field that computes along the above bins
Here we created a quarterly line chart showing missing quarters. Note that the date pill is discrete. The continuous green pill would show every missing dates instead of grains.The workbook can be found here.
Solving The Problem of Calculating Granular Differences/Changes
We can use Tableau's native quick table calculations to calculate the change ratio between two adjacent date grains in usual cases where data is available at every grains.
It becomes tricky when there are missing dates or missing weeks/months/quarters. In this case, the granular differences or change percentages will be calculated between two successive non-null data points, instead of between two adjacent dates! This result may be OK for some, maybe not be good enough for others.
In case we want to always calculate granular changes between two adjacent dates with/without missing date grains, we can use the above technique to solve it.


Nice Post! It's Really awesome please keep writing these typs of content
ReplyDeleteIs there a way to do this with a date range filter?
ReplyDeleteYes. You can.
DeleteCan you show me, how this works?
Delete