Tracking Status Change
In this case, there are 4 status for all contracts, that is, 4 buckets. At a different date, the status of a contract may change to a different one. Thus the number of contracts per status will change over time. The requirement is to visualize the number of contracts per each status at all time.
Filling the Table
The original data table as above is dotted with status changes. When status remains unchanged, the table cell is blank. Before counting the number of contracts in each of the status, we need to fill the table with actual status. The following formula [Filled Status] allows us to fill each cell with status:
- IF Isnull(Lookup(Avg(1),0)) THEN Previous_Value()
- ELSE Min([Status])
- END
By dragging [Fill Status] to Row shelf, we obtain the table below. Filled Status is computed using Table Across by default. Each square is one [Contract ID]. Histogram is about counting numbers in every bucket. Visually, we see the number of squares in those bucket but we need formula and logic to get the real numbers.
By [WindowCount], we are able to count the number of Contract IDs in each status and at every date.
- Case [Fill Status]
- When 'A' then WINDOW_COUNT(if [Fill Status]='A' then [Fill Status] end )
- When 'B' then WINDOW_COUNT(if [Fill Status]='B' then [Fill Status] end )
- When 'C' then WINDOW_COUNT(if [Fill Status]='C' then [Fill Status] end )
- When 'D' then WINDOW_COUNT(if [Fill Status]='D' then [Fill Status] end )
- End
- Set [WindowCount] to compute using Contract ID
- Set [Fill Status] to compute using Table Across or Status Date Change
Indexing and Filtering
This part deals with selecting values using 2-dimensional indexing. Quite a challenging scheme!
We got multiple instances of the same value in each bucket and we just need one. This is achieved by indexing and filtering.
Indexing of all 16 Contract IDs is done for every date, by right clicking it and selecting Compute Using>Contract ID.
It suffices to pick the first value in each bucket. [Windex] comes into play and gives us the lowest index for each bucket.
- Case [Fill Status]
- When 'A' then WINDOW_MIN(if [Fill Status]='A' then index() end )
- When 'B' then WINDOW_MIN(if [Fill Status]='B' then index() end )
- When 'C' then WINDOW_MIN(if [Fill Status]='C' then index() end )
- When 'D' then WINDOW_MIN(if [Fill Status]='D' then index() end )
- End
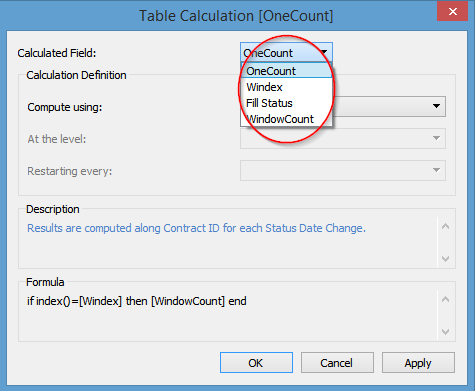
Using [Index]=[Windex] as condition, we get a single value [OneCount] for each bucket and make the rest of the bucket Null:
- If index()=[Windex] Then [WindowCount] End
There are 4 calculated fields of which table calculation needs to be set:
- [OneCount], [Windex], [WindowCount] are computed using [Contract ID].
- [Fill Status] needs to be calculated using [Status Date Change].

By holding down Ctrl key and dragging [OneCount] from Text shelf into the Filter shelf and select Special>Non-Null Values, we will filter all the Nulls. There you go. We get a table as below where there is a single value or null in each bucket.
Dressing UpAnd then we can add a bit more color to it by dragging [Filled Status] to Color shelf, and [OneCount] to Row shelf and selecting bar chart.
Tableau Zen Master Jonathan Drummey has proposed a couple of alternative solutions with his usual wizardry in this followup blog http://drawingwithnumbers.artisart.org/counting-from-nothing-a-double-remix/
ReplyDeleteAnother example of two-dimensional histogram where this approach can be applied.
ReplyDeletehttp://community.tableau.com/message/379064
here is how I would approach this situation: https://public.tableau.com/profile/joe.mako#!/vizhome/TrackingStatusjmedit/Sheet9
ReplyDeleteThe key is taking advantage of Data Densification, and filling in values so comparison can be made. The logic used is data driven instead of a having formulas with values hard coded. There are many other routes that could work as well, it just depends on what practices you are comfortable with and what your goals are. I am happy to discuss this in great detail with you.
Your solution is awesome! Totally data driven! Let me try to understand it myself first.
Delete