Following a question in Tableau Forum, I provided a solution.
The problem can be stated as follows:
Given a number of devices operating during a day, the requirement is to count the number of devices per amount of total time in operation. The question is like, how many devices operated below 10 minutes a day? how many 10-20 minutes? etc.
Wondering if there are solutions to similar problems, I googled and found that it's a fairly common problem as stated in:
http://www.theinformationlab.co.uk/2013/06/24/histograms-on-aggregate-measures/
http://community.tableau.com/thread/139950
where solutions are also provided. They are all using table calculations.
I have to admit that table calculation is one of the most dreaded functions in Tableau. Otherwise the most.
The Solution
Luckily I figured out a solution without table calc and I will present the steps here to build the histograms. I will use the same superstore data as in the Information Lab blog where we will count the number of unique customers per number of orders.
1.Drag Sum(Number of Records) to Rows shelf and turn it into discrete.
2.Drag [Customer Name] to Details shelf, a dimension needed to count the number of orders per customer.
3.Right-click and drag [Customer Name] to Columns shelf. Select CNTD().
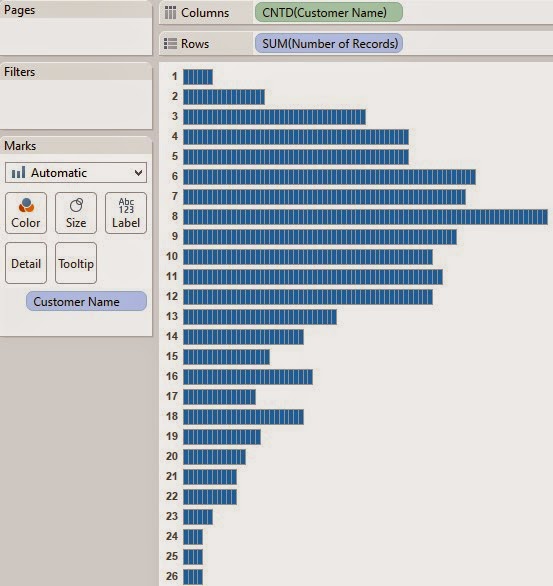
Here is what we got:

We are almost done with the histograms, aren't we?
OK, we need to clean up a bit so that we have solid color bars and labels.
Clean up
The bars are built with many tiny bricks, each representing a customer. We need to remove those border lines between the bricks. The removal is simple:
- Click Color shelf and change the border option to None.
We got solid color bars!
- Select Per Cell option, Value type label, and no Line.
The histogram graph is as beautiful as it can be.
Binning the Aggregate: Sum(Number of Records)
We have yet to group Sum(Number of Records) into bins. This can be done through a calculated field [Number of Records Bins]:
Drag this new field to replace Sum(Number of Records) in rows shelf and we get:
To be a little cleaner, I removed all the row and column dividers through formatting. The workbook can be found here.


Great post Alexander! This is a good approach and I also like to avoid table calculations in cases like this.
ReplyDeleteThere are a few other approaches to this kind of problem. A couple use table calculations and one uses sets: http://vizpainter.com/slicing-by-aggregate/
Fortunately, Tableau 9.0 will make it very easy to solve these kinds of problems with LOD calculations: http://vizpainter.com/my-favorite-tableau-9-0-feature/
Great to know so many approaches! My approach is just stacked bars. Using sets is interesting. It can be applied to variable-size bins. Will learn more about LOD. Thanks for your blog links.
DeleteAlexander thanks for the post. Is there any way we can change the values to show percent to total?
ReplyDeleteAmazing!
ReplyDeleteThis comment has been removed by a blog administrator.
ReplyDelete