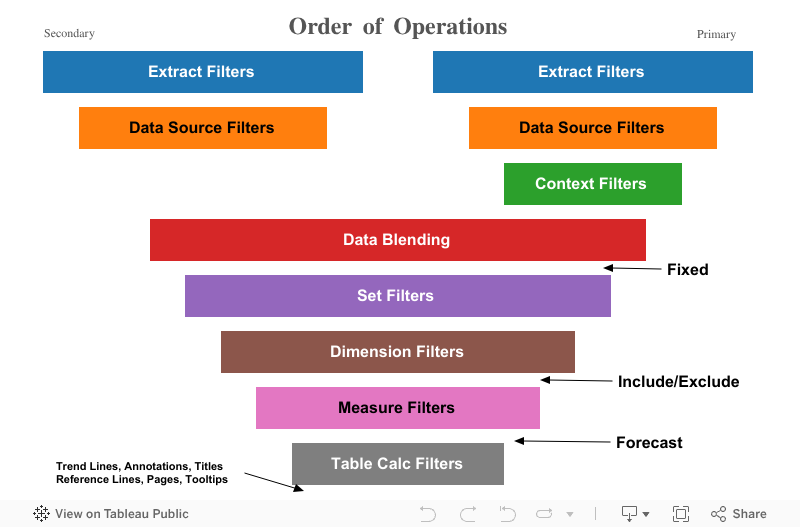
Initially Tableau published this diagram on the Order of Operations in a white paper.

The context filters are actually regular filters that we have manually assigned higher priority in execution. On the other hand, all filters provide context for the filters that follow.

- Data Blending
- Forecast
- Annotations, Reference Lines, Trend Lines, Tooltips, Pages, Titles

Now I try to integrate some of Jen's elements into a new diagram as follows. Also added primary and secondary data paths. Context filters can only be applied to the primary.
I couldn't find my original PowerPoint file in which I drew my first Precedence of Filtering diagram. And I found that using PPT to draw is a bit tedious. It's not easy to align text and may not be easy to update.
So I decided to draw the diagram in Tableau. And voila the result. Tableau can easily handle the drawing and labeling as well as tooltips. I no longer needed to struggle to align the text here and there. The diagram is based on Gantt chart.
Hope this new diagram helps you get a better understanding of Tableau's inner working.
I took a picture of this and was going to post it, too. Thanks for getting it out to the community!
ReplyDeleteAlex, thanks for posting this! The order of operations is extremely useful in understanding how Tableau gets to an end result (especially if the end result doesn't match expectations). Something doesn't quite seem right, though. For one thing, filtering based on dimensions doesn't happen post-blending. It happens for each data source (primary and secondary/ies) individually before blending. Based on yours, I put this diagram together. It may not be entirely correct (so I'm open to corrections) and definitely simplifies the pipeline (I know there are likely exceptions), but it corresponds to my current understanding of the order of operations. See you what you think:
ReplyDeletehttp://vizpainter.com/wp-content/uploads/Order-of-Operations.png
Joshua, thanks for the reply. Filtering on the secondary data source is always a challenge for me. The diagram above is mostly about filtering the primary. Could you come up with some examples? This reply in blog is not good for discussions because we can't attach pictures or screenshots etc. Let's move to the forum where more people may jump in. http://community.tableau.com/thread/192365
DeleteThe diagram is updated http://vizdiff.blogspot.com/2015/11/update-of-order-of-operations-diagram.html
ReplyDeleteHi Alex! Here's the version we used at TC15: https://www.dropbox.com/s/l3m8s2lu7a6dzji/Pipeline.png
ReplyDeleteGlad you enjoyed the session :)
Thanks Kelly!
DeleteA couple more updates since:
http://vizdiff.blogspot.com/2015/12/the-order-of-operations-within.html
http://vizdiff.blogspot.com/2015/11/update-of-order-of-operations-diagram.html
The order of operations diagram is updated again on 12/10/2015. The change is to make dimension filters take precedence over data blending.
ReplyDeletehttp://vizdiff.blogspot.com/2015/12/the-order-of-operations-diagram-update.html
This comment has been removed by the author.
ReplyDeleteThose extract filters, data source filters, or even dimension filters are before row level calculations. Those filters are excluding the data not relevant to the view. Then row level calculations start.
Delete