
Oct
28
Resolving Simpson's Paradox: The Whole vs The Parts
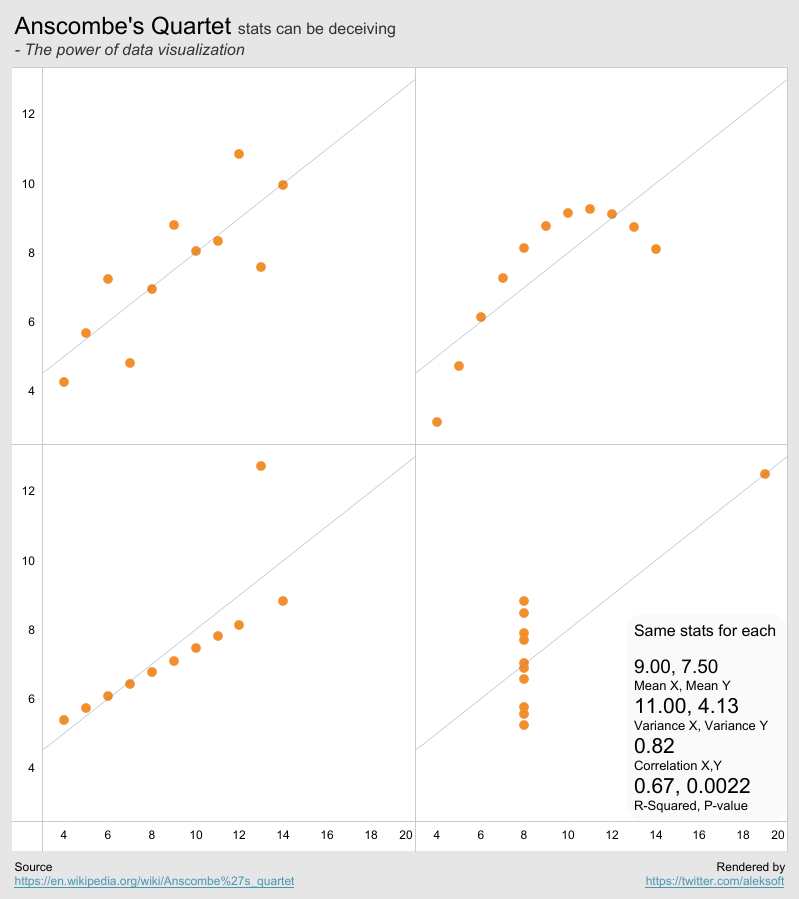
Christine suggested me to have a look at Simpson's Paradox, following my recent posts on Anscrombe's Quartet and Datasaurus Dozen. They are all about learning to look at statistics in an impartial way.
Simpson's Paradox is about the difference between the stats of an entire data set and the stats of the same data set sliced by a dimension. They can be quite different or even contradictory. We can't take one for the other.
We are going to show some visualization techniques to compare the whole vs the parts through two examples.
UC Berkeley Admission Gender Bias
The data is from here. From the campus total percentage, we see that the admission rate is 39%. Then men's rate is 45% and women's is 30%. So it seems that there is a campus wide bias against women.
