The commute traffic is really light this morning. I guess that a significant number of people must be taking the day off to spend the day with their loved ones.
Yesterday I created this little mobile viz for the special day. It's all using math functions to draw the picture.
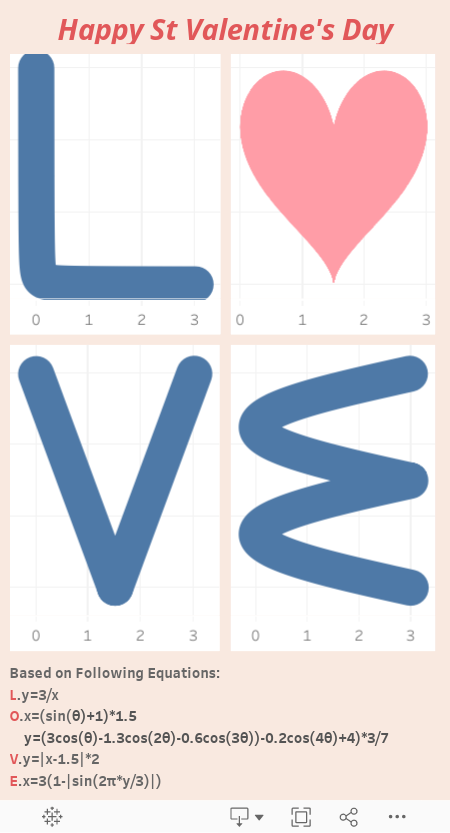
I used Professor Jeffrey Schaffer's method to create the heart shape here. He explained very well his method already.
The method I used to draw the other letters are similar to Schaffer's. We differ only in functions, plus some scaling and shifting factors. Here are my steps:
1.Create a 2-row field [Endpoint] as the data source.
2.Create a parameter N (where 1201 is picked as the default value)
3.Create a calculated field Range that goes from 1 to N.
4.Create a bin on Range with bin size=1
5.Create an Index
6.Create Pi=Windows_Max(Max(PI())). This makes Pi available everywhere.
Now we have all the infrastructure for drawing those letters and shapes.
For letter L, the math function is y=1/x. The way to translate it to tableau formula is as follows.
- x = 3*Index/N
- y = 3/Index
We added scaling factors in the formula so that all the charts are within the x<=3 and y<=3 grid.
The caveats:
1.Set all fields to calculate using Range (bin)
2.Drag Range (bin) to Rows first. Select Show Missing Values (data densification). Then drag it to Details shelf. Directly dragging Range (bin) to the Details may not trigger data densification.
3.PI() function is not available at densified rows. That's why we resorted to a window function.
4.We added some scaling and shifting factors to the functions. Otherwise, they could be simpler.
The process is similar to other letters.
For letter V: (function y=|x-1.5|*2)
- x = [Index]*3/[N]
- y = ABS(2*[Index]/[N]-1)*3
For letter E: (function x=3*(1-|sin(2π*y/3)|)
- x=3*(1-ABS(SIN(([Index]-1)*2*[Pi]/[N])))
- y=[Index]*3/[N]
I could have created a circle (x^2+9^2=9) for the letter O. But the heart shape is much better! I included the O formula in the workbook.
Have a great St Valentine's Day!
[Update] The above is created with 4 charts, one letter each. Below is another design with 4 letters drawn on a single chart. The advantage is we don't have to manually adjust the sizes of those 4 indivisual charts.

Hi Alexander Mou, I tried implementing the above experiment in my Tableau. I was able to get the letter V and the LOVE symbol as told by Professor Jeffrey Schaffer, but couldn't figure out a way to find the letters L and E. Can you please suggest me a way so that I can get to those values.
ReplyDeleteThe formula for all letters are given in the above text. You missed them?
DeleteAlso, you can download the workbook and see what's inside.
Hi Alexander Mou, I do copy pasted those values to my Tableau report but was still not able to get the required result. As I have mentioned in the previous message I was able to get the letter V with the same formula that was provided. Issue is with the letters L and E.
DeleteThis comment has been removed by the author.
DeleteThis are the detailed steps to follow:
Deletethe issue is at data densification. google it to learn more.
1.Set x and y to compute using Range Bin
2.Drag Range Bin to Rows
3.Right click Range Bin and select Show Missing Value. This will trigger data to densify. At the lower left corner, the number of data marks should change from 2 to 1201.
4.Select Line as data marks. Move Range Bin pill to Path.
You might lose the data densification. Just move the pill one more time.